
How We Stopped Node.js Container OOM Crashes Under Heavy Load by Switching to jemalloc
The Problem: OOM Kills That Made No Sense
We had a fleet of Node.js microservices handling 2M+ API requests per day across containerised workloads. The system was stable — until sustained traffic bursts started triggering OOM kills in production. Containers would run fine for hours, then abruptly get terminated by the kernel with no warning in the application logs.
Each container had a 512 MB memory limit, and heap profiling consistently showed usage at 250–300 MB. On paper, we had 40% headroom. So what was eating the rest?
Chasing the RSS Ghost
Before jumping to theories, we needed data. I added a lightweight /debug/memory endpoint to expose both V8 and process-level metrics:
app.get('/debug/memory', (req, res) => {
  const mem = process.memoryUsage();
  res.json({
    rss: (mem.rss / 1024 / 1024).toFixed(2) + ' MB',
    heapUsed: (mem.heapUsed / 1024 / 1024).toFixed(2) + ' MB',
    heapTotal: (mem.heapTotal / 1024 / 1024).toFixed(2) + ' MB',
    external: (mem.external / 1024 / 1024).toFixed(2) + ' MB',
    arrayBuffers: (mem.arrayBuffers / 1024 / 1024).toFixed(2) + ' MB',
  });
});
After running under load for a few hours, the numbers told the story: heapUsed sat at ~280 MB while rss climbed past 480 MB. That 200 MB gap was the smoking gun. The heap wasn't leaking — something outside V8's managed memory was hoarding pages and never giving them back.
The Root Cause: Allocator Fragmentation
Node.js uses V8's managed heap for JavaScript objects, but relies on the system's C memory allocator — glibc's ptmalloc2 on most Linux distributions — for everything else: native buffers, thread stacks, and V8 internals.
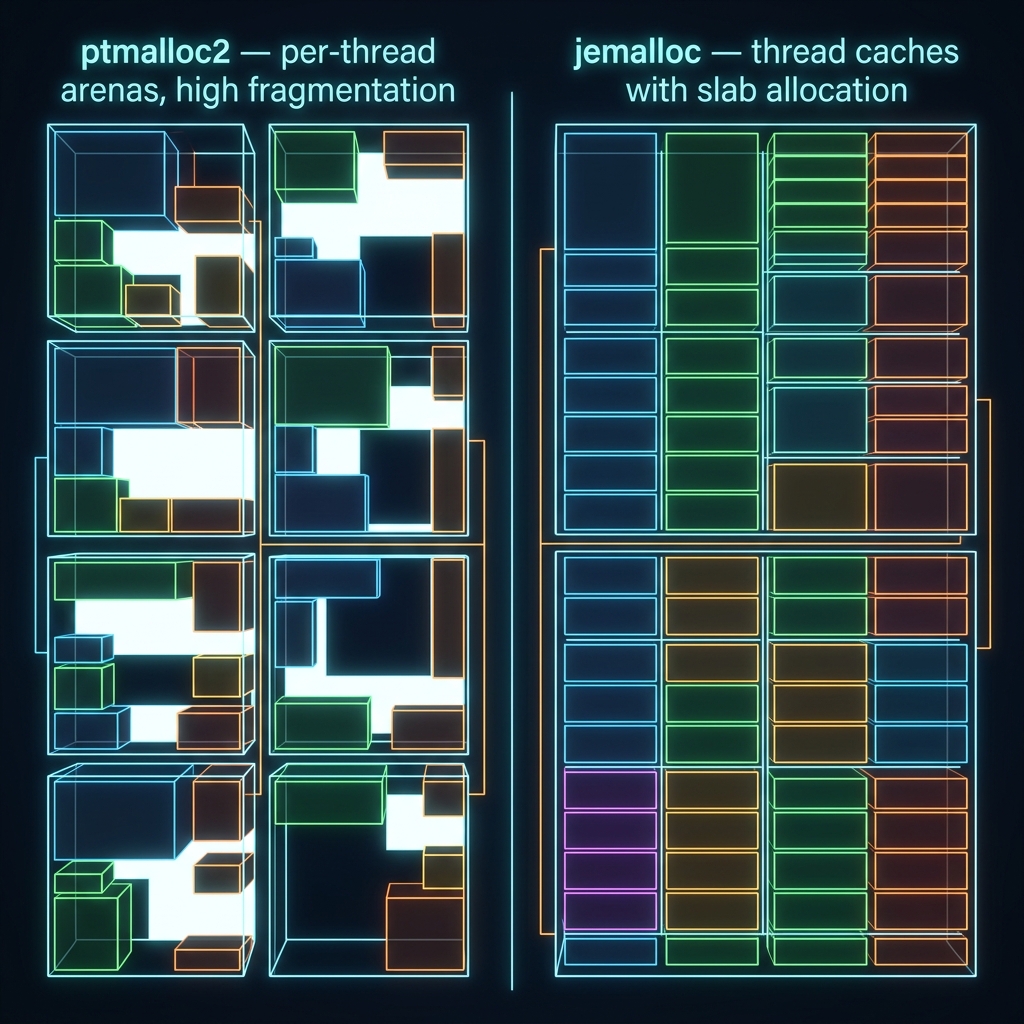
ptmalloc2 uses per-thread memory arenas to reduce lock contention. Under high concurrency, each arena independently requests memory from the OS, and freed memory in one arena can't be reused by another. The allocator holds onto pages it isn't actively using but can't return to the OS.
In containerised environments with hard memory limits, fragmentation isn't just wasteful — it's fatal. The OOM killer doesn't care about your heap size; it cares about RSS.
At our concurrency levels, the libuv worker pool, DNS resolution threads, and crypto operations were enough to create dozens of arenas, each hoarding freed fragments. Mystery solved — now we needed a fix.
The Fix: Switching to jemalloc
jemalloc is a general-purpose memory allocator originally developed for FreeBSD. It's the default allocator in Redis and has been battle-tested in large-scale systems serving billions of requests. Its key advantages over ptmalloc2 for our use case:
- Thread-cache design that reuses memory across threads more aggressively
- Slab-based allocation that reduces fragmentation for small objects
- Automatic dirty-page purging that returns unused memory to the OS
The switch required zero code changes. We modified our Dockerfile to install jemalloc and preload it via LD_PRELOAD:
FROM node:20-slim

# Install jemalloc
RUN apt-get update && \
    apt-get install -y --no-install-recommends libjemalloc2 && \
    rm -rf /var/lib/apt/lists/*

# Preload jemalloc as the default allocator
# For ARM64 (e.g., Graviton): use /usr/lib/aarch64-linux-gnu/libjemalloc.so.2
ENV LD_PRELOAD=/usr/lib/x86_64-linux-gnu/libjemalloc.so.2

# Enable background thread for async dirty-page purging
ENV MALLOC_CONF="background_thread:true,metadata_thp:auto"

WORKDIR /app
COPY package*.json ./
RUN npm ci --omit=dev
COPY . .

CMD ["node", "dist/server.js"]
The LD_PRELOAD environment variable tells the dynamic linker to load jemalloc before glibc, effectively replacing every malloc/free call in the process — including those made by V8 internals and native modules. The MALLOC_CONF line enables a background thread that asynchronously purges dirty pages, smoothing out latency spikes.
Measuring the Impact
We deployed to a canary container and ran identical load tests. The results:
| Metric | ptmalloc2 (before) | jemalloc (after) | Change |
|---|---|---|---|
| Peak RSS under load | 485 MB | 335 MB | -31% |
| RSS after load subsides | 410 MB | 295 MB | -28% |
| OOM kills (7-day window) | 12 | 0 | -100% |
| p99 response latency | 142 ms | 138 ms | -3% |
The RSS-to-heap gap shrank from ~200 MB to under 50 MB. After validating the canary for 48 hours with zero OOM kills, we rolled the change across all production services.
When jemalloc Won't Help
jemalloc isn't a silver bullet. If your OOM crashes stem from actual memory leaks — unbounded caches, event listeners piling up, unconsumed streams — switching allocators only delays the inevitable. I learned this the hard way on an earlier project, where I spent days diagnosing what looked like fragmentation in a high-load Node.js service, only to find a MongoDB cursor that was never closed in an error path.
Rule out genuine leaks first: use --inspect with Chrome DevTools for heap snapshots, check for growing external memory, and watch event listener counts via process._getActiveHandles(). jemalloc solves fragmentation, not leaks.
Key Takeaways
- RSS ≠ Heap: Node.js memory usage extends far beyond V8's managed heap. Monitor RSS alongside heap metrics, especially in containerised environments.
- glibc's allocator fragments under concurrency:
ptmalloc2's per-thread arena design causes memory bloat in multi-threaded workloads like Node.js under load. - jemalloc is a drop-in fix: A single
LD_PRELOADline in your Dockerfile can eliminate fragmentation-driven OOM crashes with zero code changes. - Measure before and after: Expose
process.memoryUsage()and compare RSS against heap to quantify the fragmentation gap. - Rule out real leaks first: Allocator swaps mask leaks. Always confirm fragmentation is the root cause before reaching for jemalloc.
If your Node.js containers are mysteriously breaching memory limits despite well-behaved heap usage, the allocator is likely the culprit. The fix is three lines in a Dockerfile, and it might just save your on-call engineers a few 3 AM pages.
Himanshu Shrivastava
Senior Full Stack Engineer · Node.js · React · TypeScript · AWS · Accessibility